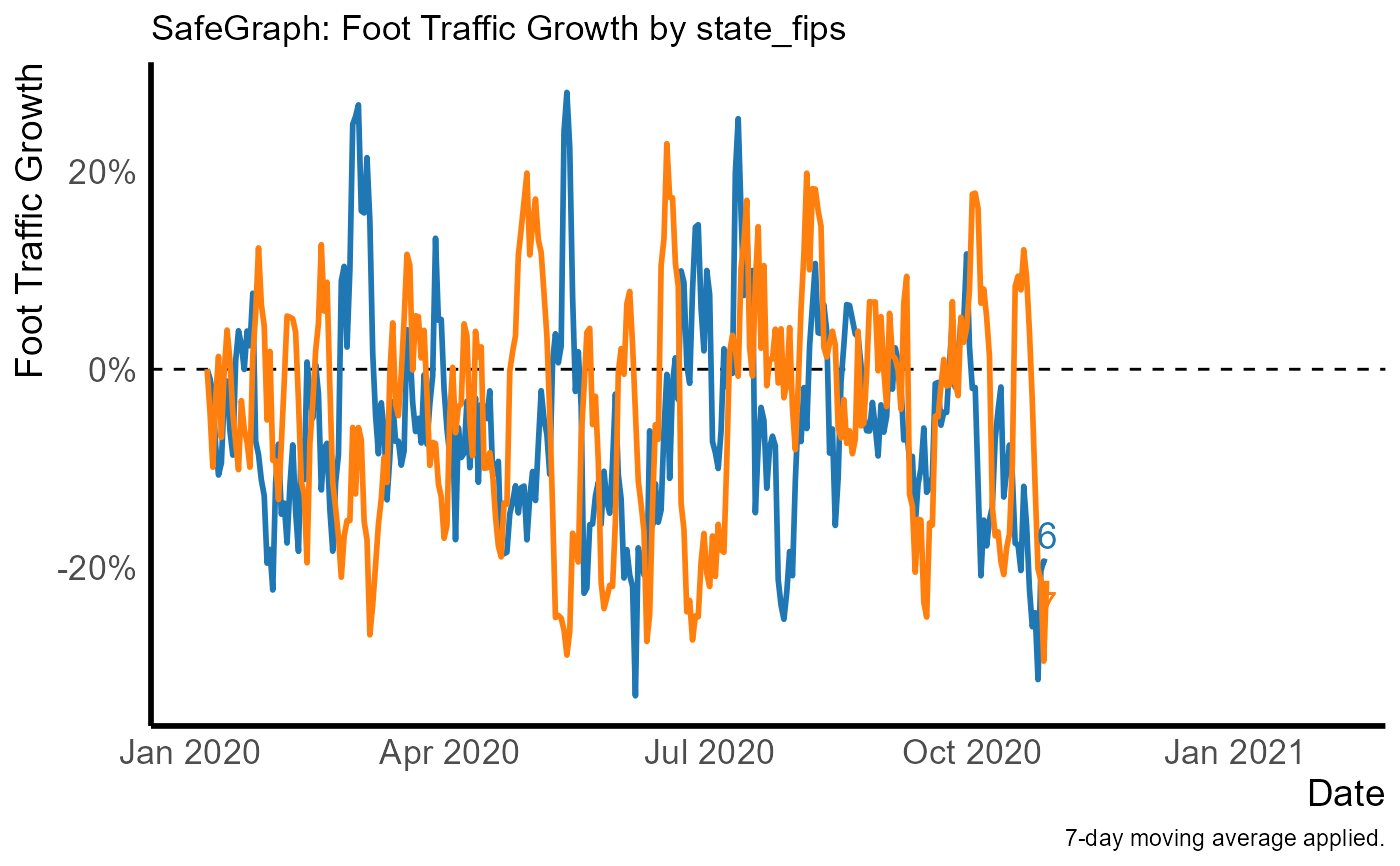
Produce a nice-looking graph of foot traffic growth over time
graph_template.RdProduces a line graph with labels at the end of the lines, with theming designed for the purpose. Returns a ggplot object that can be further modified as normal. Requires that the **ggplot2**, **ggrepel**, and **paletteer** packages be installed.
graph_template(
  dt,
  date = "date",
  growth = "growth",
  origin = 0,
  filter = NULL,
  by = NULL,
  x_title = "Date",
  y_title = "Foot Traffic Growth",
  title = ifelse(is.null(by), "SafeGraph: Foot Traffic Growth",
    paste0("SafeGraph: Foot Traffic Growth by ", paste(by, collapse = ", "))),
  caption = "7-day moving average applied.",
  subtitle = NULL,
  label = !is.null(by),
  hline = TRUE,
  expand_right = NULL,
  palette = "ggsci::category20_d3",
  manual_palette = NULL,
  skip_theming = FALSE,
  line_opts = list(size = 1),
  label_opts = list(size = 14/ggplot2::.pt, hjust = -0.2, vjust = 0.5, direction = "y"),
  hline_opts = list(size = 0.5, linetype = "dashed", color = "black")
)
Arguments
- dt
A
data.table(or something that can be coerced todata.table). There must be one observation perdateperbyin this data.- date
Character variable indicating the date variable (x axis).
- growth
Character variable indicating the growth variable (y axis).
- origin
The value indicating no growth/initial value.
- filter
A character variable describing a subset of the data to include, for example
filter = 'state_fips == 6'to only include California.- by
A character variable of the variable name to assign to the
coloraesthetic inggplot2::geom_line(). The values of this variable will also be sent toggrepel::geom_text_repel().- x_title
Axis title for x-axis.
- y_title
Axis title for y-axis.
- title
Graph title.
- caption
Figure caption.
- subtitle
Graph subtitle.
- label
Should a text label be applied at the end of each line?
- hline
Should a horizontal line at the
originvalue be included?- expand_right
Number of additional days to extend the x-axis by so as to fit the labels. Defaults to adding 33 percent more days so a quarter of the graph is reserved for labels.
- palette
Discrete color palette from the **paletteer** package to be sent to
paletteer::scale_color_paletteer_d(). If you like, the default **ggplot2** color theme is'basetheme::default'.- manual_palette
Manually-specified color palette to be sent to the
valuesoption ofggplot2::scale_color_manual().- skip_theming
Don't apply the template theming, so you can apply your own.
- line_opts
A named list of options to be sent to
ggplot2::geom_line().- label_opts
A named list of options to be sent to
ggrepel::geom_text_repel(). Only relevant iflabel = TRUE.- hline_opts
A named list of options to be sent to
ggplot2::geom_hline(), only relevant ifhline = TRUE.
Examples
# Generally you'd be doing this with data that comes from read_many_patterns()
# But here's an example using randomly generated data

dt <- data.table::data.table(date = rep(lubridate::ymd('2020-01-01') + lubridate::days(0:300),2),
                             state_fips = c(rep(6, 301), rep(7,301)),
                             visits_by_day = rpois(602, lambda = 10))

norm <- data.table::data.table(date = rep(lubridate::ymd('2020-01-01') + lubridate::days(0:300),2),
                               state_fips = c(rep(6, 301), rep(7,301)),
                               total_devices_seen = rpois(602, lambda = 10000))

processed_data <- processing_template(dt, norm = norm, by = 'state_fips')

p <- graph_template(processed_data, by = 'state_fips')
#> Warning: `guides(<scale> = FALSE)` is deprecated. Please use `guides(<scale> = "none")` instead.

p